
What’s Driving Stocks, Bonds, and All-Time Highs?
The stock market has climbed to new all-time highs following several periods of uncertainty this year. This is welcome news for investors, especially because many parts of the market have contributed to the rally, including sectors such as Energy, Information Technology, and Industrials. Interest rates are also near multi-decade highs, pushing bond yields to their most attractive levels in years. At the same time, investors should always be prepared for periods of volatility, which the past few years have shown can occur at any time.
For long-term investors, rising stock prices and higher yields create an environment that requires careful portfolio balance. On the surface, it can seem contradictory for stocks to reach records while interest rates stay high, since rising rates can often slow the economy. However, if both stocks and bonds are being supported by positive trends, long-term portfolios can in turn support financial goals. How should investors think about this environment as markets sit near record levels?
Stocks and bonds support portfolio balance, but in different ways
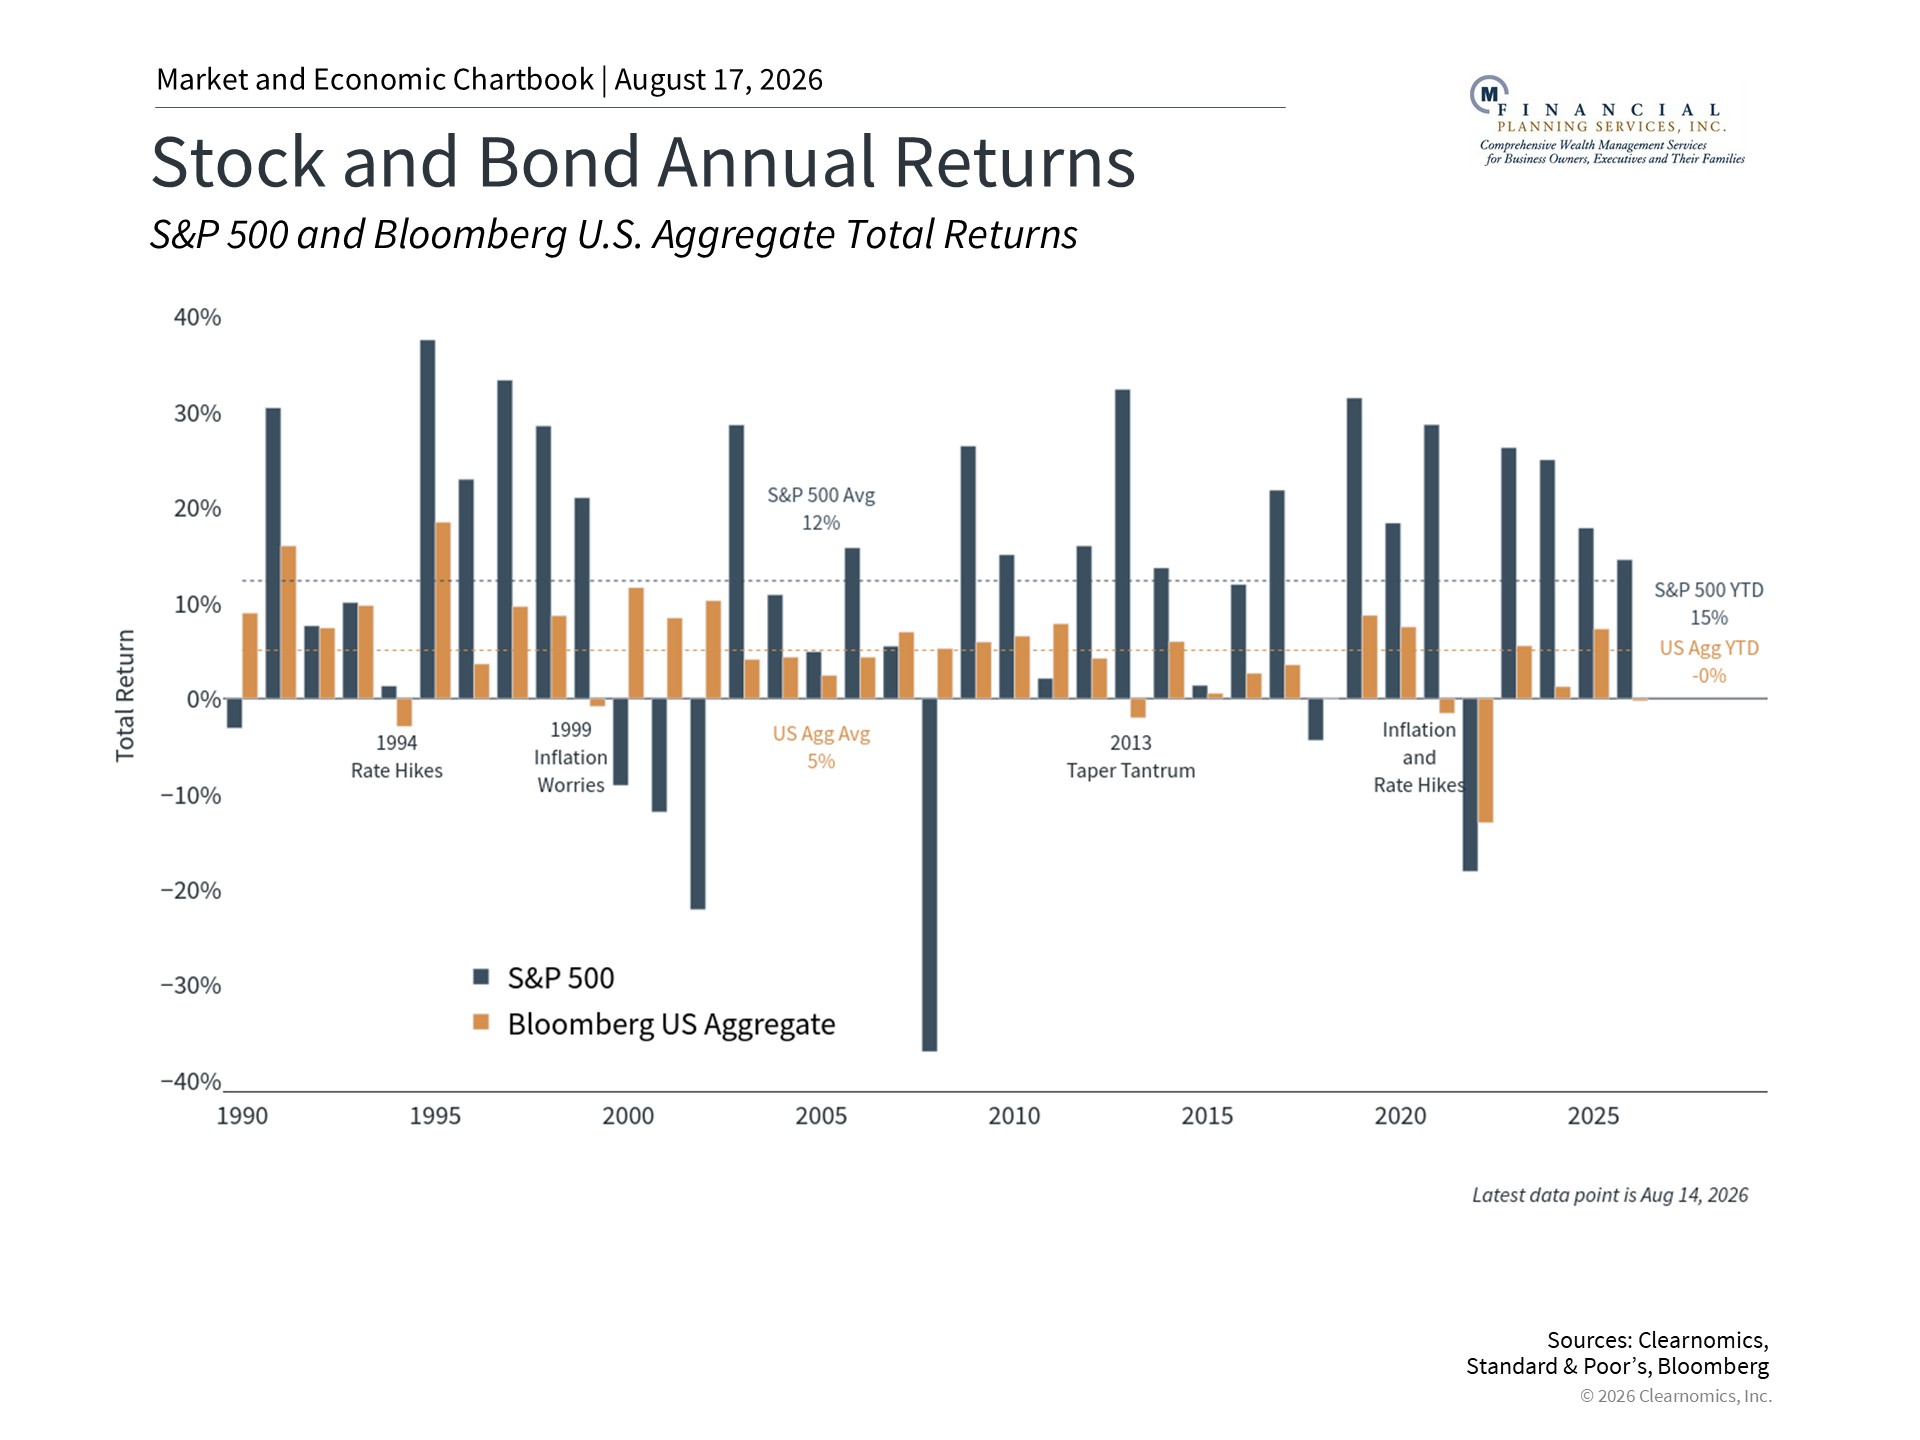
The S&P 500, Nasdaq, and the Dow Jones Industrial Average have all generated double digit-total returns this year.1 There are important themes driving markets on the surface, influencing which parts of the market have contributed to these returns. Perhaps the most visible are that artificial intelligence continues to drive technology stocks, and the energy sector has been supported by higher oil prices. These are the factors most often cited in the headlines, and they help explain why major indices have reached new highs.
Another important factor is that corporate earnings have grown at a historic pace, providing a fundamental foundation for the rally. In the long run, economic growth helps to drive corporate profits, which then pushes stock prices higher. Interestingly, corporate profits have increased significantly in recent years, despite modest economic growth. Current forecasts suggest that the S&P 500 could reach an earnings-per-share figure of $347 this year, representing an annual growth rate of over 30%. This growth rate, if achieved, would be well above the historical average of around 8%.2
However, there is another important driver of the recent rally in the S&P 500: the Fed and interest rates. In the short run, markets can be highly sensitive to expectations around Fed policy. This is because interest rates play an important role in calculating the price of stocks today based on cash flows in the future. Since oil prices began to rise earlier this year, markets have expected the Fed to hike rates to combat inflation. Given the recent cooling of the labor market and steady inflation readings, these expectations have declined, with only one quarter-point hike priced in by next January.
The key to understanding the impact across stocks and bonds is that interest rates can rise for different reasons. Rates that rise because of inflation concerns can act as a drag on both asset classes, as they did in 2022 when the Fed tightened policy aggressively. However, rates can also rise because economic growth expectations are improving, which pushes up what are known as “real rates,” or the interest rate after accounting for inflation.3 Stronger real rates help support market valuations through improved earnings, while also offering bond investors more attractive yields.
This helps explain why stocks have continued to climb even as rates remain elevated. The chart above shows the relationship between stock and bond returns over the past few decades, including the long periods in which both asset classes perform well during economic expansions. For investors, the lesson is not to try to predict market returns or interest rates, but to hold a portfolio that can benefit from the strengths of each.
Waiting for pullbacks is often counterproductive
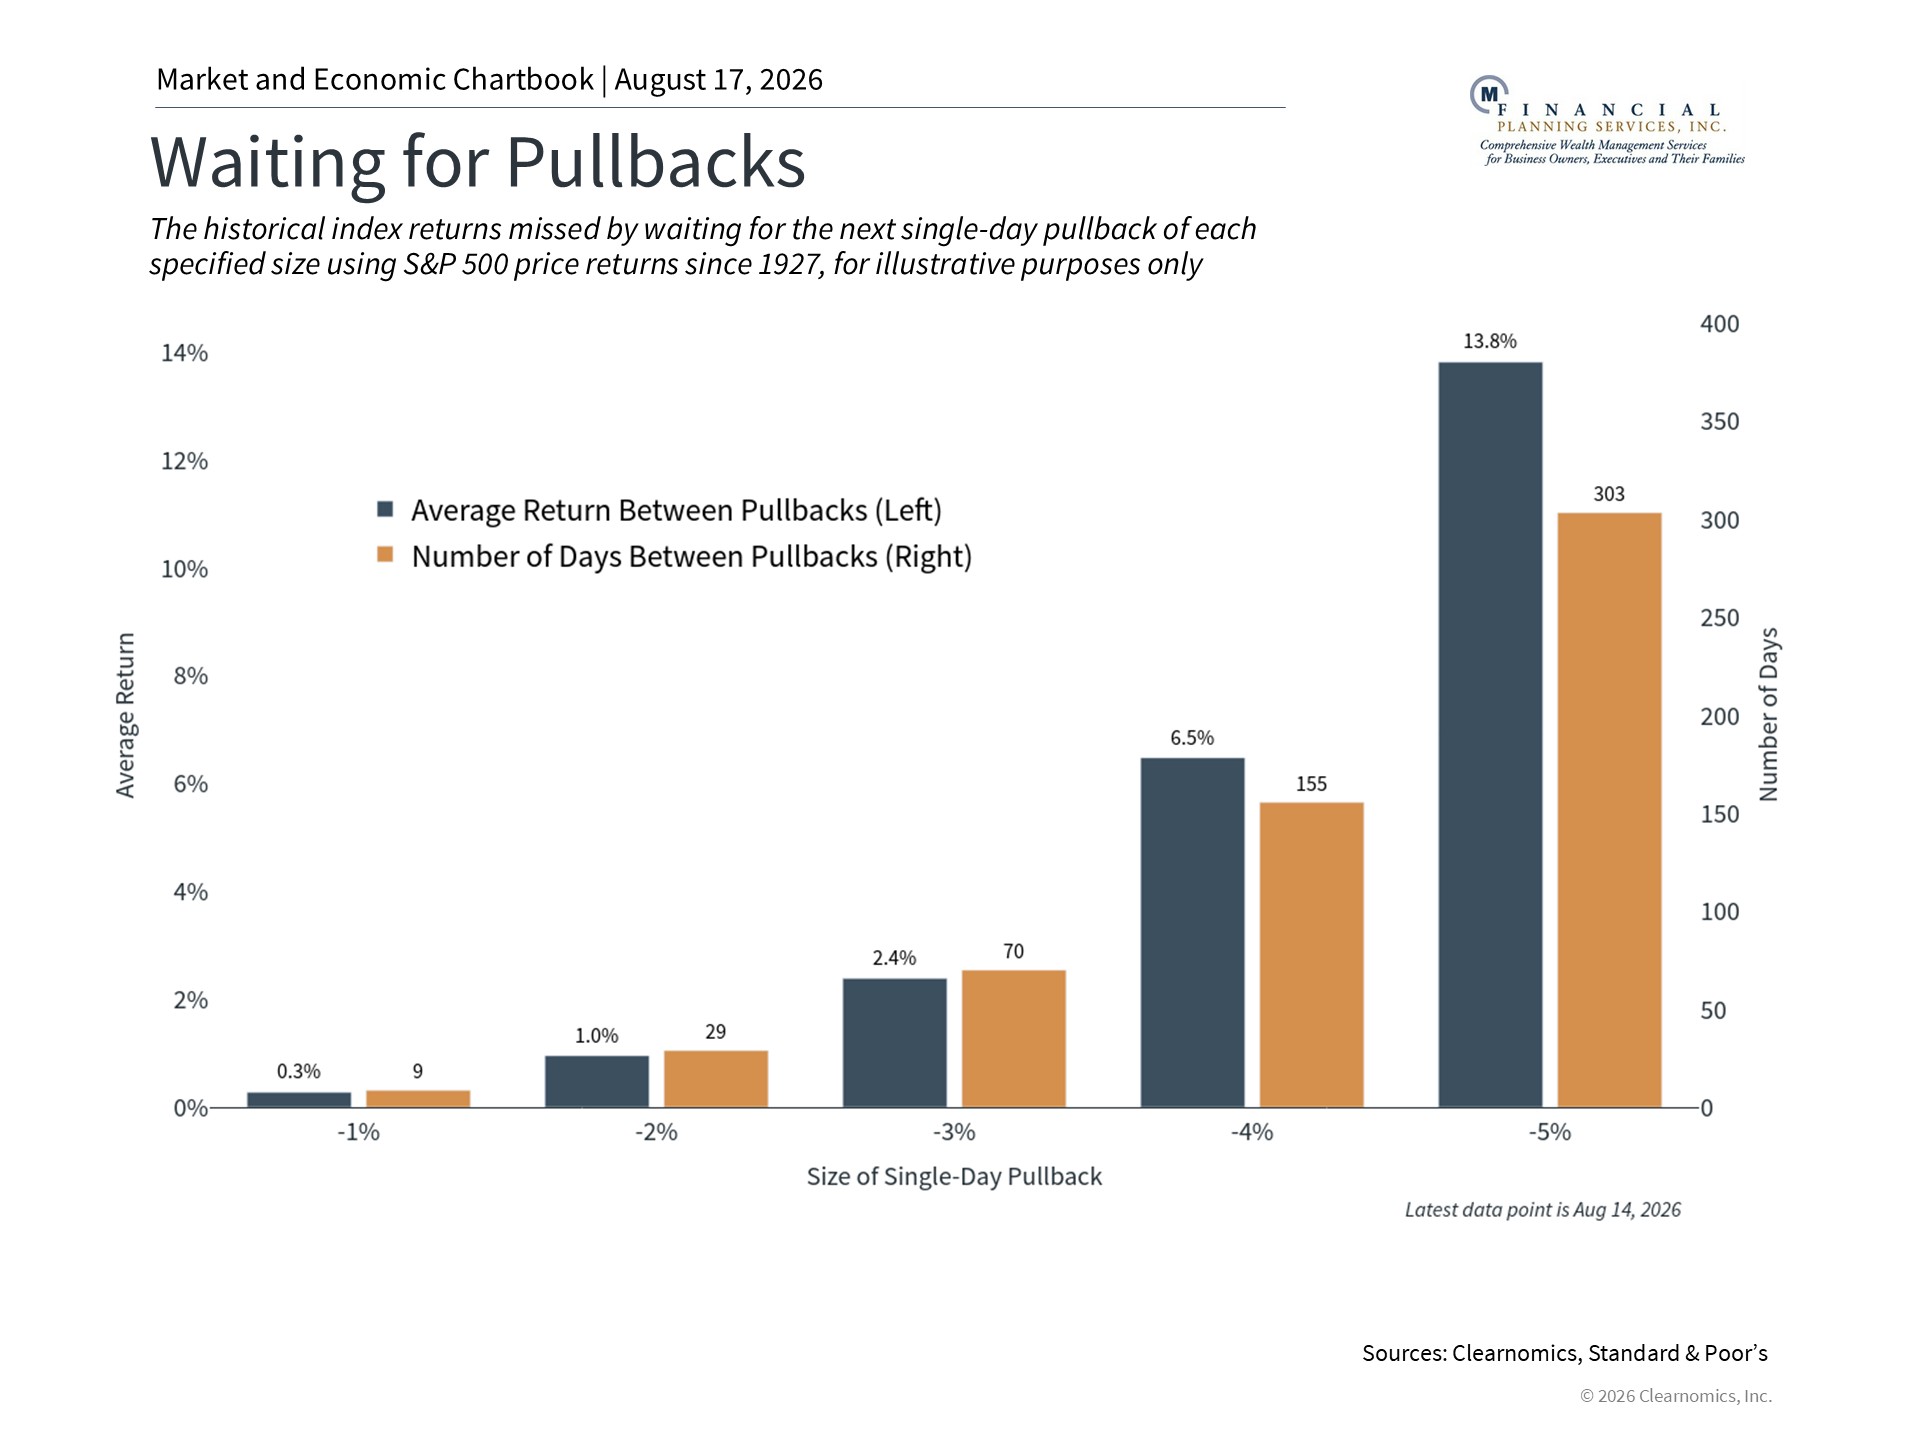
With markets near all-time highs, a natural question for many investors is whether they should make portfolio adjustments, or wait before getting invested. History shows that since the economy and markets tend to grow over the long term, trying to time these movements can be counterproductive, and the opportunity cost of waiting is often higher than simply getting invested.
The chart above shows that waiting for the perfect entry point often doesn’t work. For example, an investor waiting for a 5% pullback before investing would have waited 291 days on average. During that time, the market would have already gained nearly 14%. So, even though pullbacks of 5% or worse do occur periodically, and each time is different, the fact that the market tends to rise over time means the next dip is often higher than the last. In other words, the investor who waited would frequently have been better off simply staying invested from the start.
This is not to say that markets move in straight lines, or that pullbacks do not occur. Rather, it reinforces that new all-time highs are a normal part of bull markets, and the best way to achieve long-term goals is often to simply hold onto a well-constructed portfolio.
Of course, there are other strategies for those who need to improve their asset allocations. For example, for those who need to invest a lump sum at these valuations, approaches such as dollar-cost averaging can be helpful. Similarly, balancing a portfolio across different sectors, styles, factors, and geographies can help to reduce exposure to areas of the market with high valuations, while allowing investors to benefit from potential growth.
Bond yields drive long-term fixed income returns
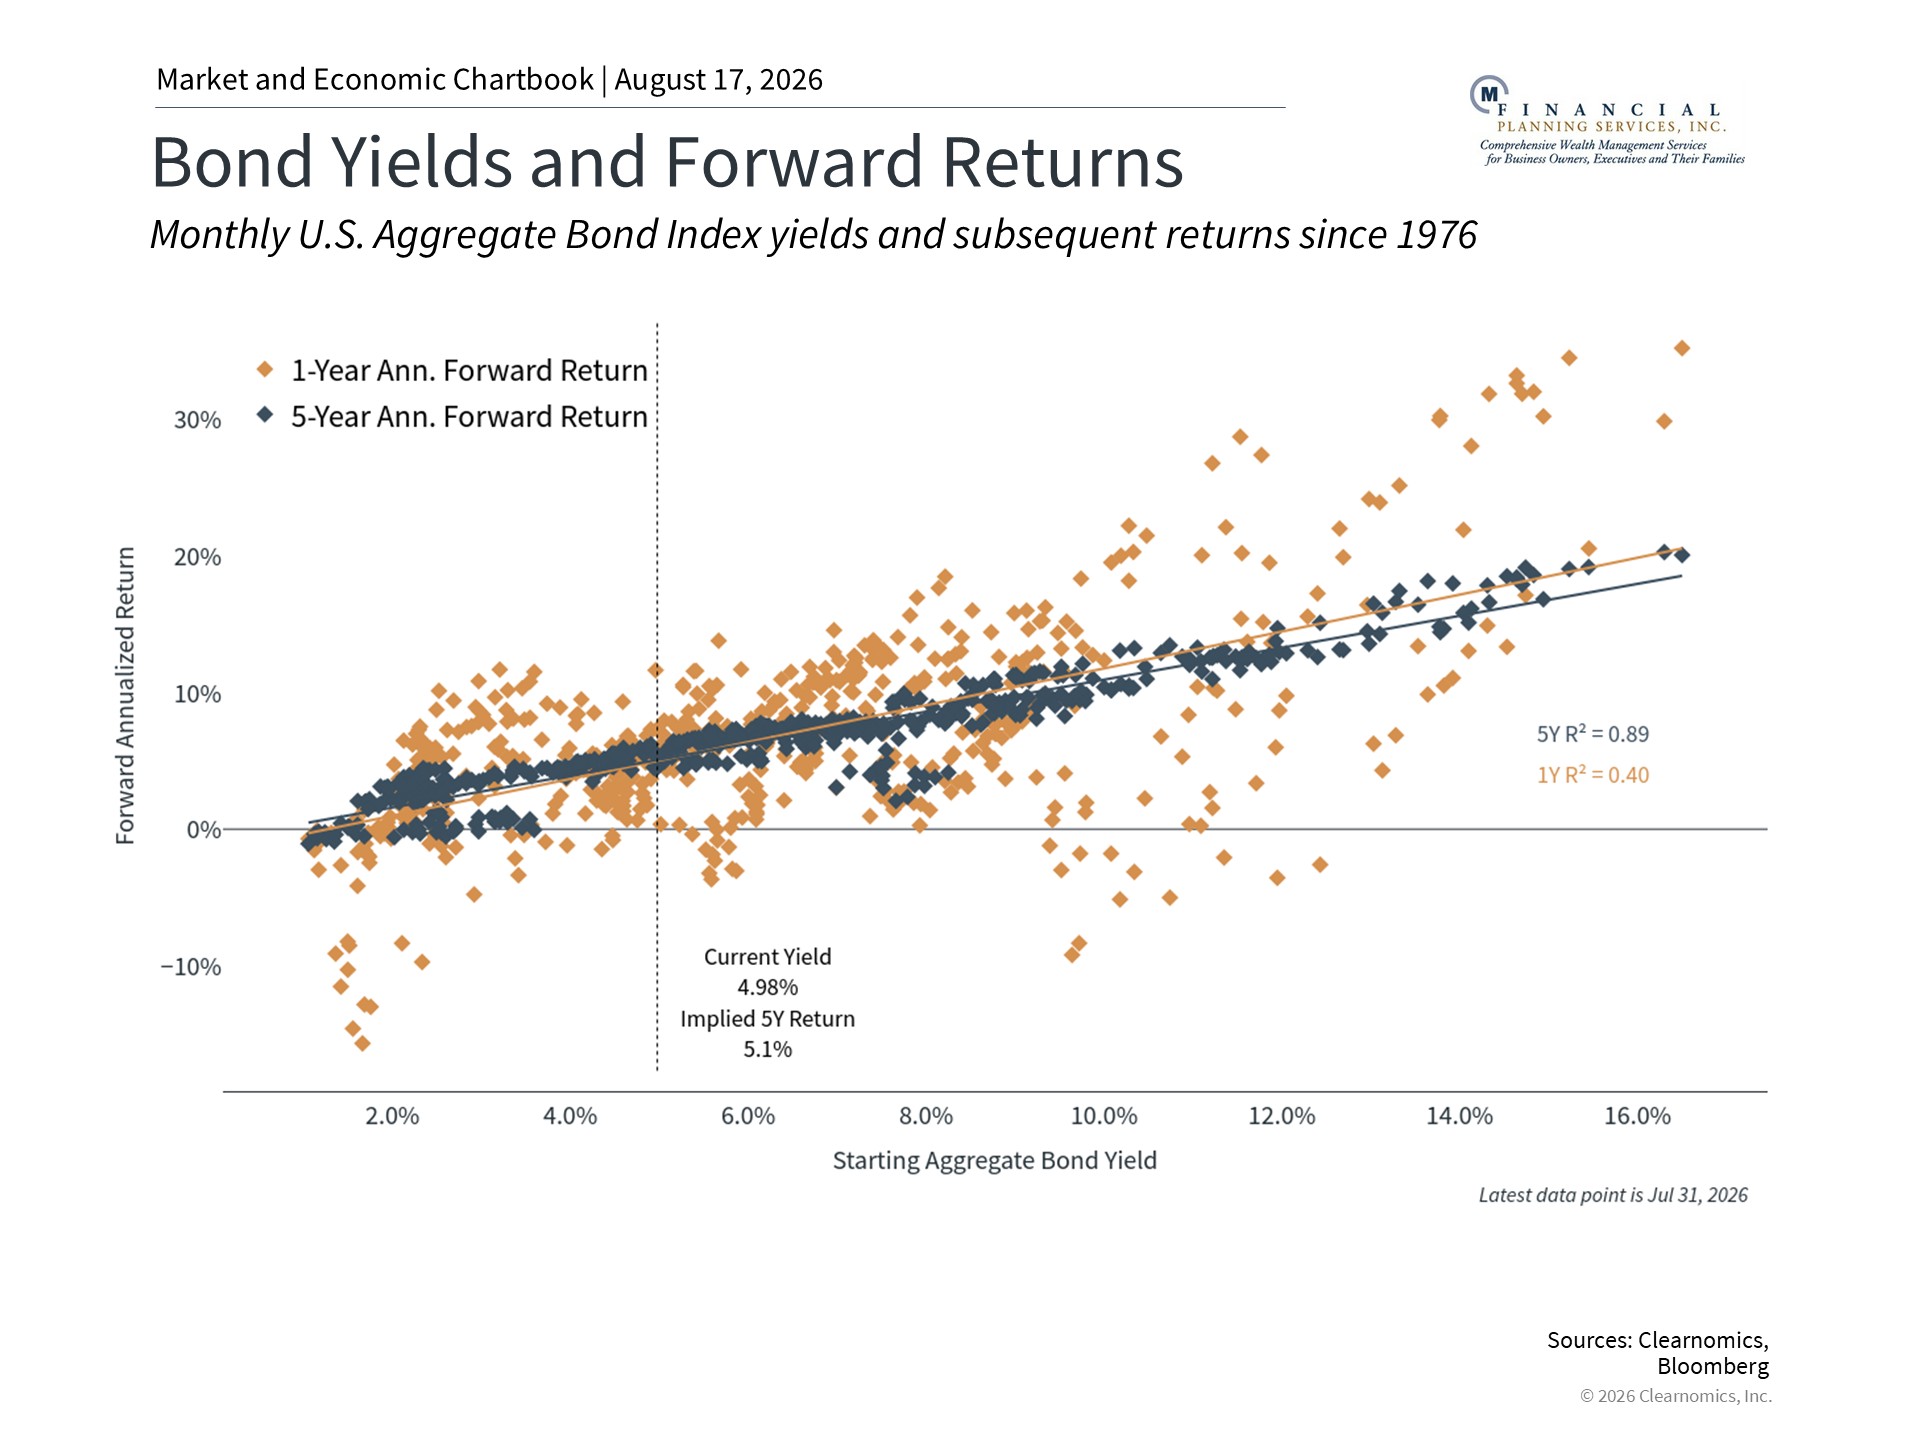
While the stock market has performed well this year, bonds have been flat due to rising interest rates. Bond prices move in the opposite direction of yields, so higher rates mean that existing bonds are less valuable. However, it’s also the case that investors benefit when they can reinvest in bonds at higher yields, or adjust their portfolios to take advantage of them, if it’s appropriate for their financial plans.
The chart above shows that the starting yield of a bond is an important part of long run returns. At the moment, bond yields have rarely been more attractive over the past two decades. Investment grade corporate bonds and Treasury securities are now offering income levels that were difficult to find during the years following the global financial crisis, when interest rates were held near zero.4 For investors who rely on their portfolios for income, or who are simply looking to balance the risk of equities, this creates greater opportunities across fixed income than have existed in many years.
So, while higher rates can weigh on bond prices, they also mean that bonds can play an important role in portfolios. When combined with stock market trends that have helped portfolios this year, these asset classes can support the financial goals of long-term investors.
The bottom line? Stocks have benefited from growth trends while bond yields are historically attractive, creating opportunities across both asset classes. For long-term investors, maintaining a balanced portfolio is the best way to benefit from this environment while staying focused on financial goals.
References
1. Standard & Poor’s and Nasdaq as of August 14, 2026
2. Clearnomics research using Standard & Poor’s and LSEG data, as of August 14, 2026
3. https://home.treasury.gov/resource-center/data-chart-center/interest-rates
4. Clearnomics research and Bloomberg data, as of August 14, 2026
Index Descriptions
S&P 500
The Standard & Poor’s 500 Index is a capitalization-weighted index of 500 stocks designed to measure performance of the broad domestic economy through changes in the aggregate market value of 500 stocks representing all major industries.
Dow Jones
The Dow Jones Industrial Average consists of 30 stocks that are major factors in their industries and widely held by individuals and institutional investors.
NASDAQ
The NASDAQ Composite Index measures all NASDAQ domestic and non-U.S. based common stocks listed on The NASDAQ Stock Market. The market value, the last sale price multiplied by total shares outstanding, is calculated throughout the trading day, and is related to the total value of the Index.
Bloomberg US Aggregate Bond Index
The Bloomberg U.S. Aggregate Bond Index is an index of the U.S. investment-grade fixed-rate bond market, including both government and corporate bonds.
Securities and advisory services offered through LPL Financial, a registered investment advisor. Member FINRA / SIPC. Financial planning offered through M Financial Planning Services, a Registered Investment Advisor and a separate entity.
This material is for general information only and is not intended to provide specific advice or recommendations for any individual. There is no assurance that the views or strategies discussed are suitable for all investors or will yield positive outcomes. Investing involves risks including possible loss of principal. No investment strategy or risk management technique can guarantee return or eliminate risk in all market environments Any economic forecasts set forth may not develop as predicted and are subject to change.
References to markets, asset classes, and sectors are generally regarding the corresponding market index. Indexes are unmanaged statistical composites and cannot be invested into directly. Index performance is not indicative of the performance of any investment and do not reflect fees, expenses, or sales charges. All performance referenced is historical and is no guarantee of future results.
This information is not intended to be a substitute for specific individualized tax or legal advice. We suggest that you discuss your specific situation with a qualified tax or legal professional.
Bonds are subject to market and interest rate risk if sold prior to maturity. Bond values will decline as interest rates rise and bonds are subject to availability and change in price.
U.S. Treasury securities are guaranteed by the federal government as to the timely payment of principal and interest. The principal value of Treasury securities and other bonds fluctuates with market conditions.
International investments carry additional risks, which include differences in financial reporting standards, currency exchange rates, political risks unique to a specific country, foreign taxes and regulations, and the potential for illiquid markets. These factors may result in greater share price volatility.
This material was prepared by Clearnomics, Inc., who is not affiliated with the named financial professional, firm or broker/dealer.