
What Rising Real Yields Mean for Investors
Treasury rates have surged to their highest levels in recent years due to a combination of concerns around inflation, oil
prices, the national debt, and the Fed. The 10-year Treasury yield is once again above 4.6% and the 30-year has been
above 5% for the longest streak since 2007.1 In general, this is positive for long-term investors since higher yields
support portfolio goals such as income and stability.
Perhaps more importantly, real yields have risen even further. For investors, these moves are helpful to understand
because they influence many aspects of investing and planning. Portfolios and financial plans should take these
evolving interest rates and economic circumstances into careful consideration, especially because they have changed
significantly over the past decade.
The difference between nominal and real interest rates is quite simple, even if it sounds technical. A nominal yield is
simply the stated interest rate on a bond, whether it’s a corporate investment grade bond or a U.S. Treasury note. The
real yield goes one step further by showing what an investor earns after adjusting for inflation. Real yields represent the
true return for savers, and therefore serve as a key benchmark against which all other asset classes are measured. Given
the importance of rising real yields, what do investors need to consider?
Long-term real yields are near multi-year highs
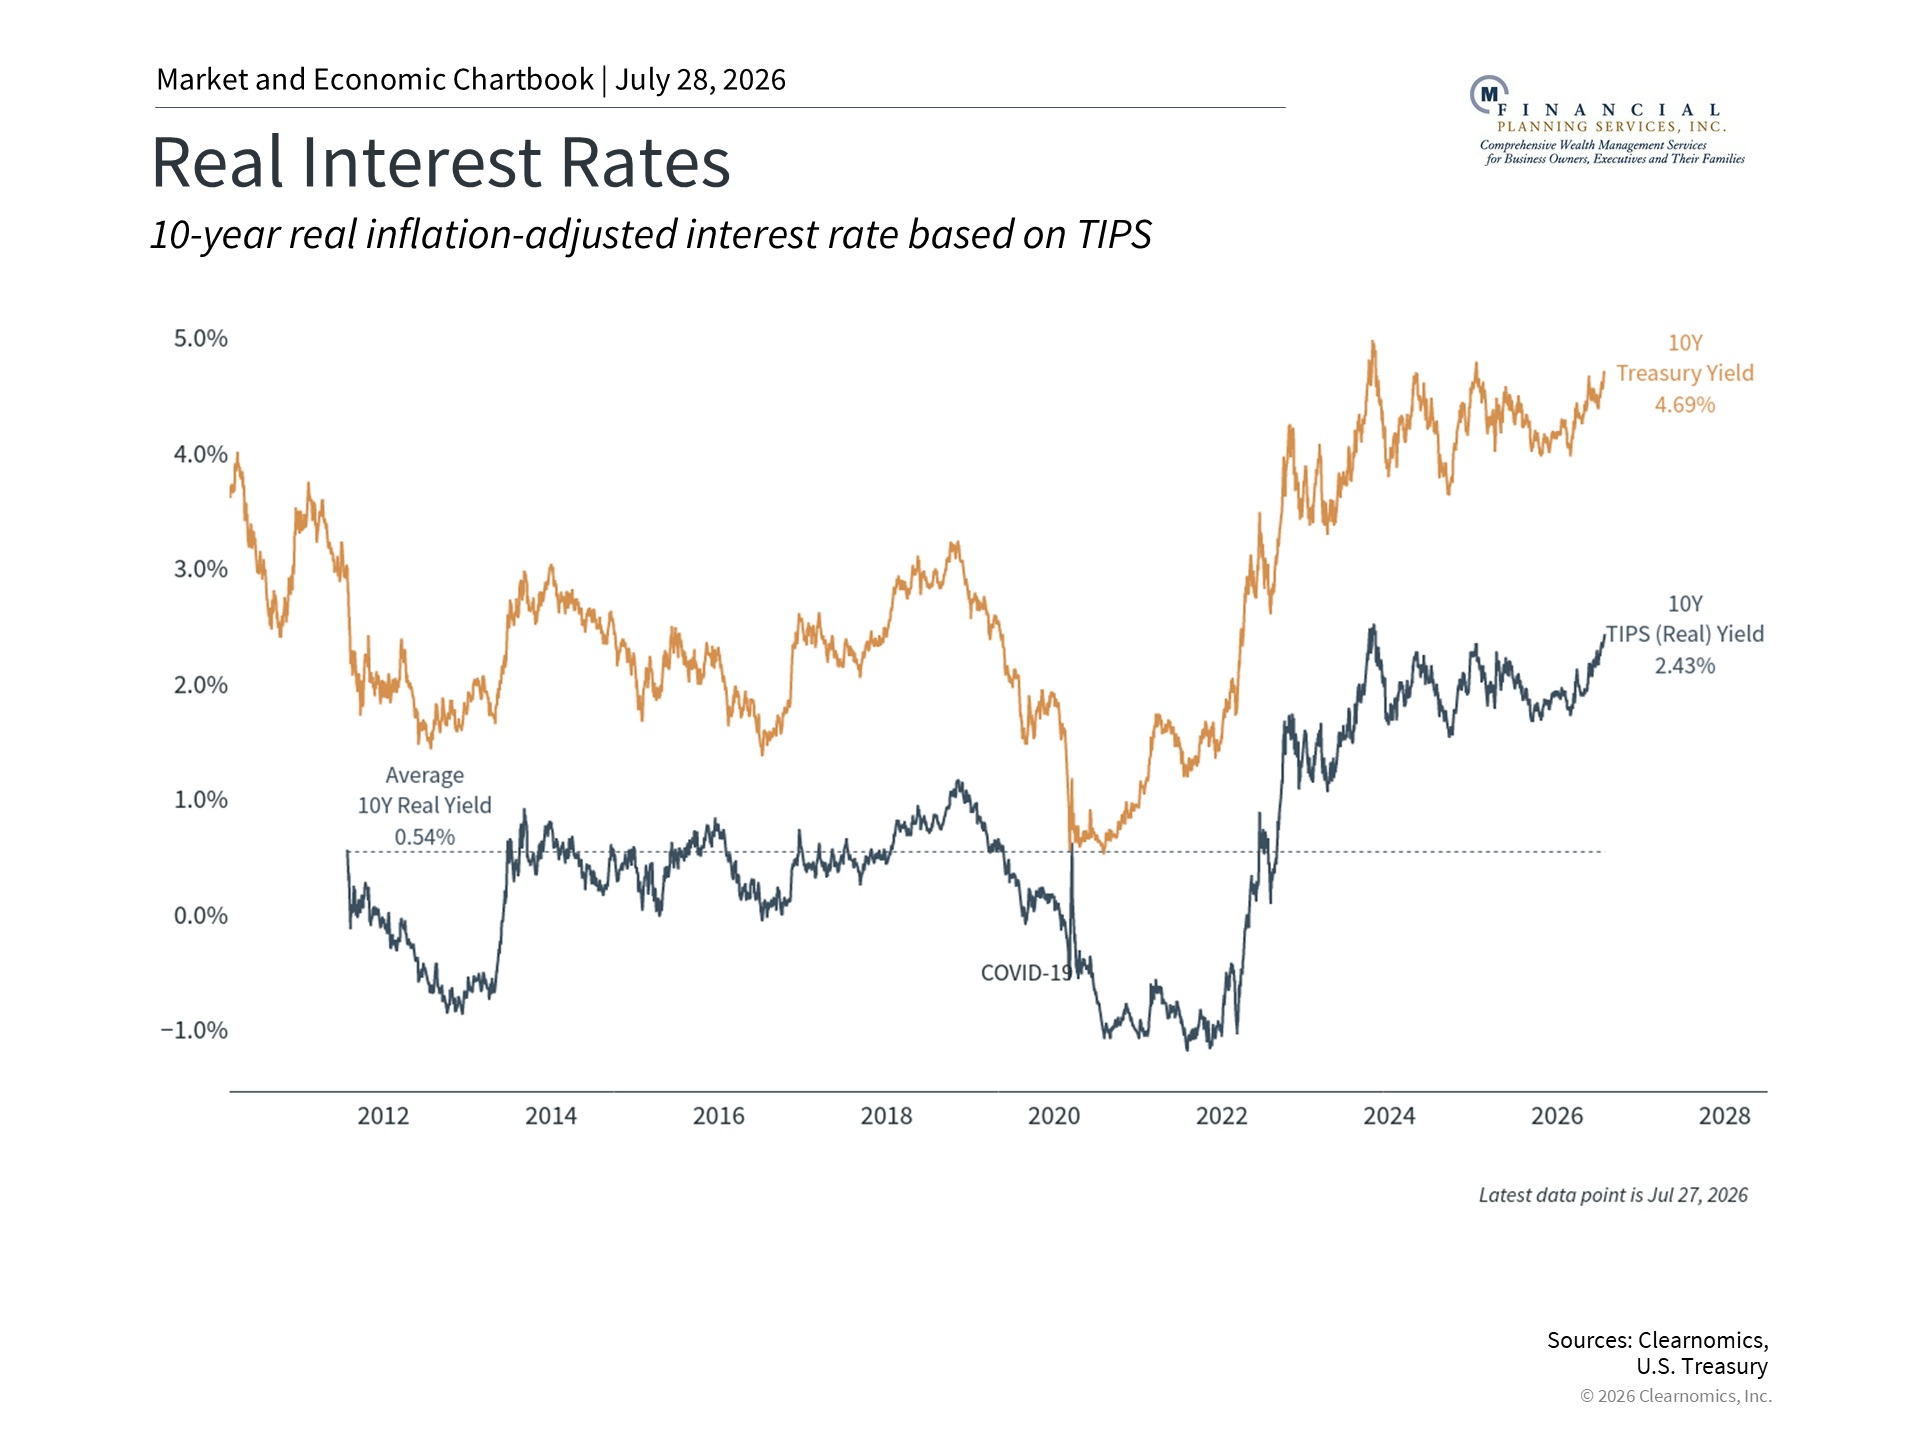
The chart above shows how real yields have evolved over the past decade and a half. In 2020, for instance, real yields on government bonds actually turned negative, meaning investors were either expecting little to no inflation in the coming years, or accepting a guaranteed loss of purchasing power for the safety of U.S. Treasury securities. This was in large part by design as the Fed cut rates to support the economy and push investors toward stocks, real estate, and other higher-yielding assets.
Yields then shifted in 2022 when inflation spiked, prompting the Fed to reverse course by raising the federal funds rate at the fastest pace in decades. Both nominal and real yields surged as a result. Today, the 10-year nominal Treasury yield stands at roughly 4.7% while the corresponding real yield is 2.4%, well above levels since the global financial crisis. This is based on expectations of inflation over the next ten years, and not just the latest figures.
Several factors are keeping long-term yields elevated today. Oil prices have risen back above $90 per barrel for Brent
crude amid the ongoing war in Iran, and gasoline prices have climbed back above $4 per gallon nationally.2 Higher
energy costs can feed directly into broader inflation, which in turn pushes nominal yields higher. What’s interesting is
that inflation expectations haven’t risen much based on market measures and surveys, but this is largely because many
anticipate the Fed may raise rates over the next several months to fight rising prices.
Separately, the rising national debt and federal budget deficit continue to create uncertainty for government bond
yields. This affects what economists call the “term premium,” or the extra yield investors require to hold longer-term
bonds. With the total national debt now above $39 trillion, greater interest payments naturally raise the borrowing cost
for the government, pushing U.S. Treasury yields higher.3
Higher yields affect all parts of the market
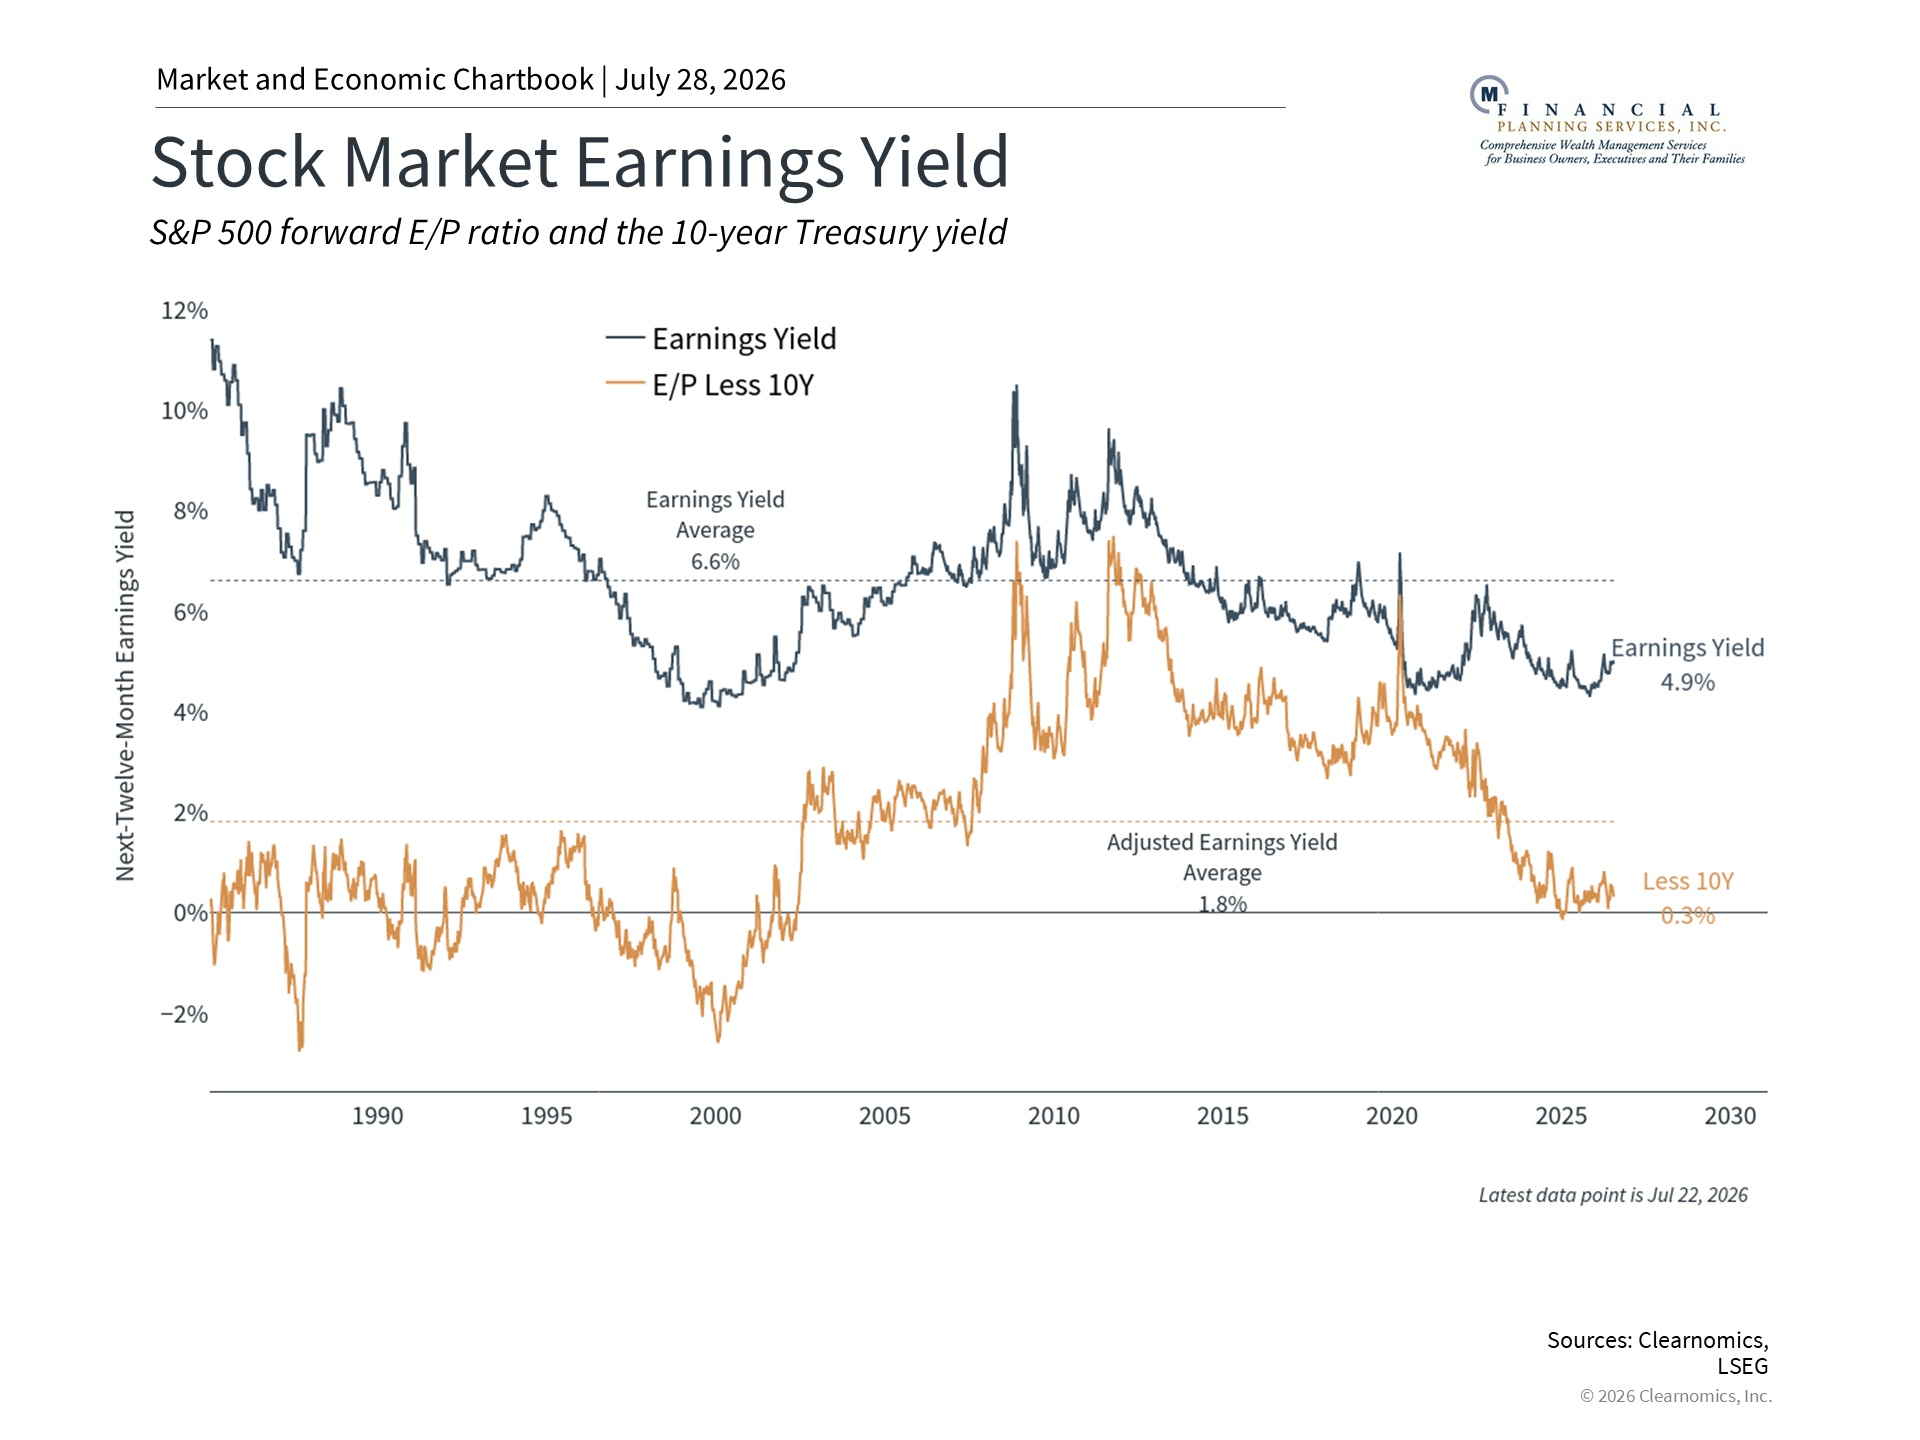
Interest rates are not just about bonds, but affect how attractive different asset classes are compared to one another. This is especially important for longterm investors since it influences the relative attractiveness of different asset classes in a balanced portfolio. For example, the chart above shows the S&P 500 earnings yield, which is the level of earnings-per-share divided by the price of the S&P 500. This is an important valuation measure that helps us compare the stock market against
bond yields.
This comparison is often referred to as the “equity risk premium” since it measures how much additional benefit is available for taking on greater risk in the stock market. When real bond yields were near zero or negative, as they were for much of the post-2008 era, stocks had little competition. Investors accepted lower earnings yields from equities because there were few alternatives for yield and growth. This was commonly referred to as TINA, or “there is no alternative.”
At current levels, the 10-year real yield of 2.4% means that investors can earn an attractive, inflation-adjusted return
from government bonds. The S&P 500 earnings yield sits at roughly 4.9%, corresponding to a forward price-to-earnings
ratio of around 20x. This means that understanding and evaluating the balance of stocks and bonds in a portfolio is
potentially more important than before.4
The Fed balance sheet and what it means for yields
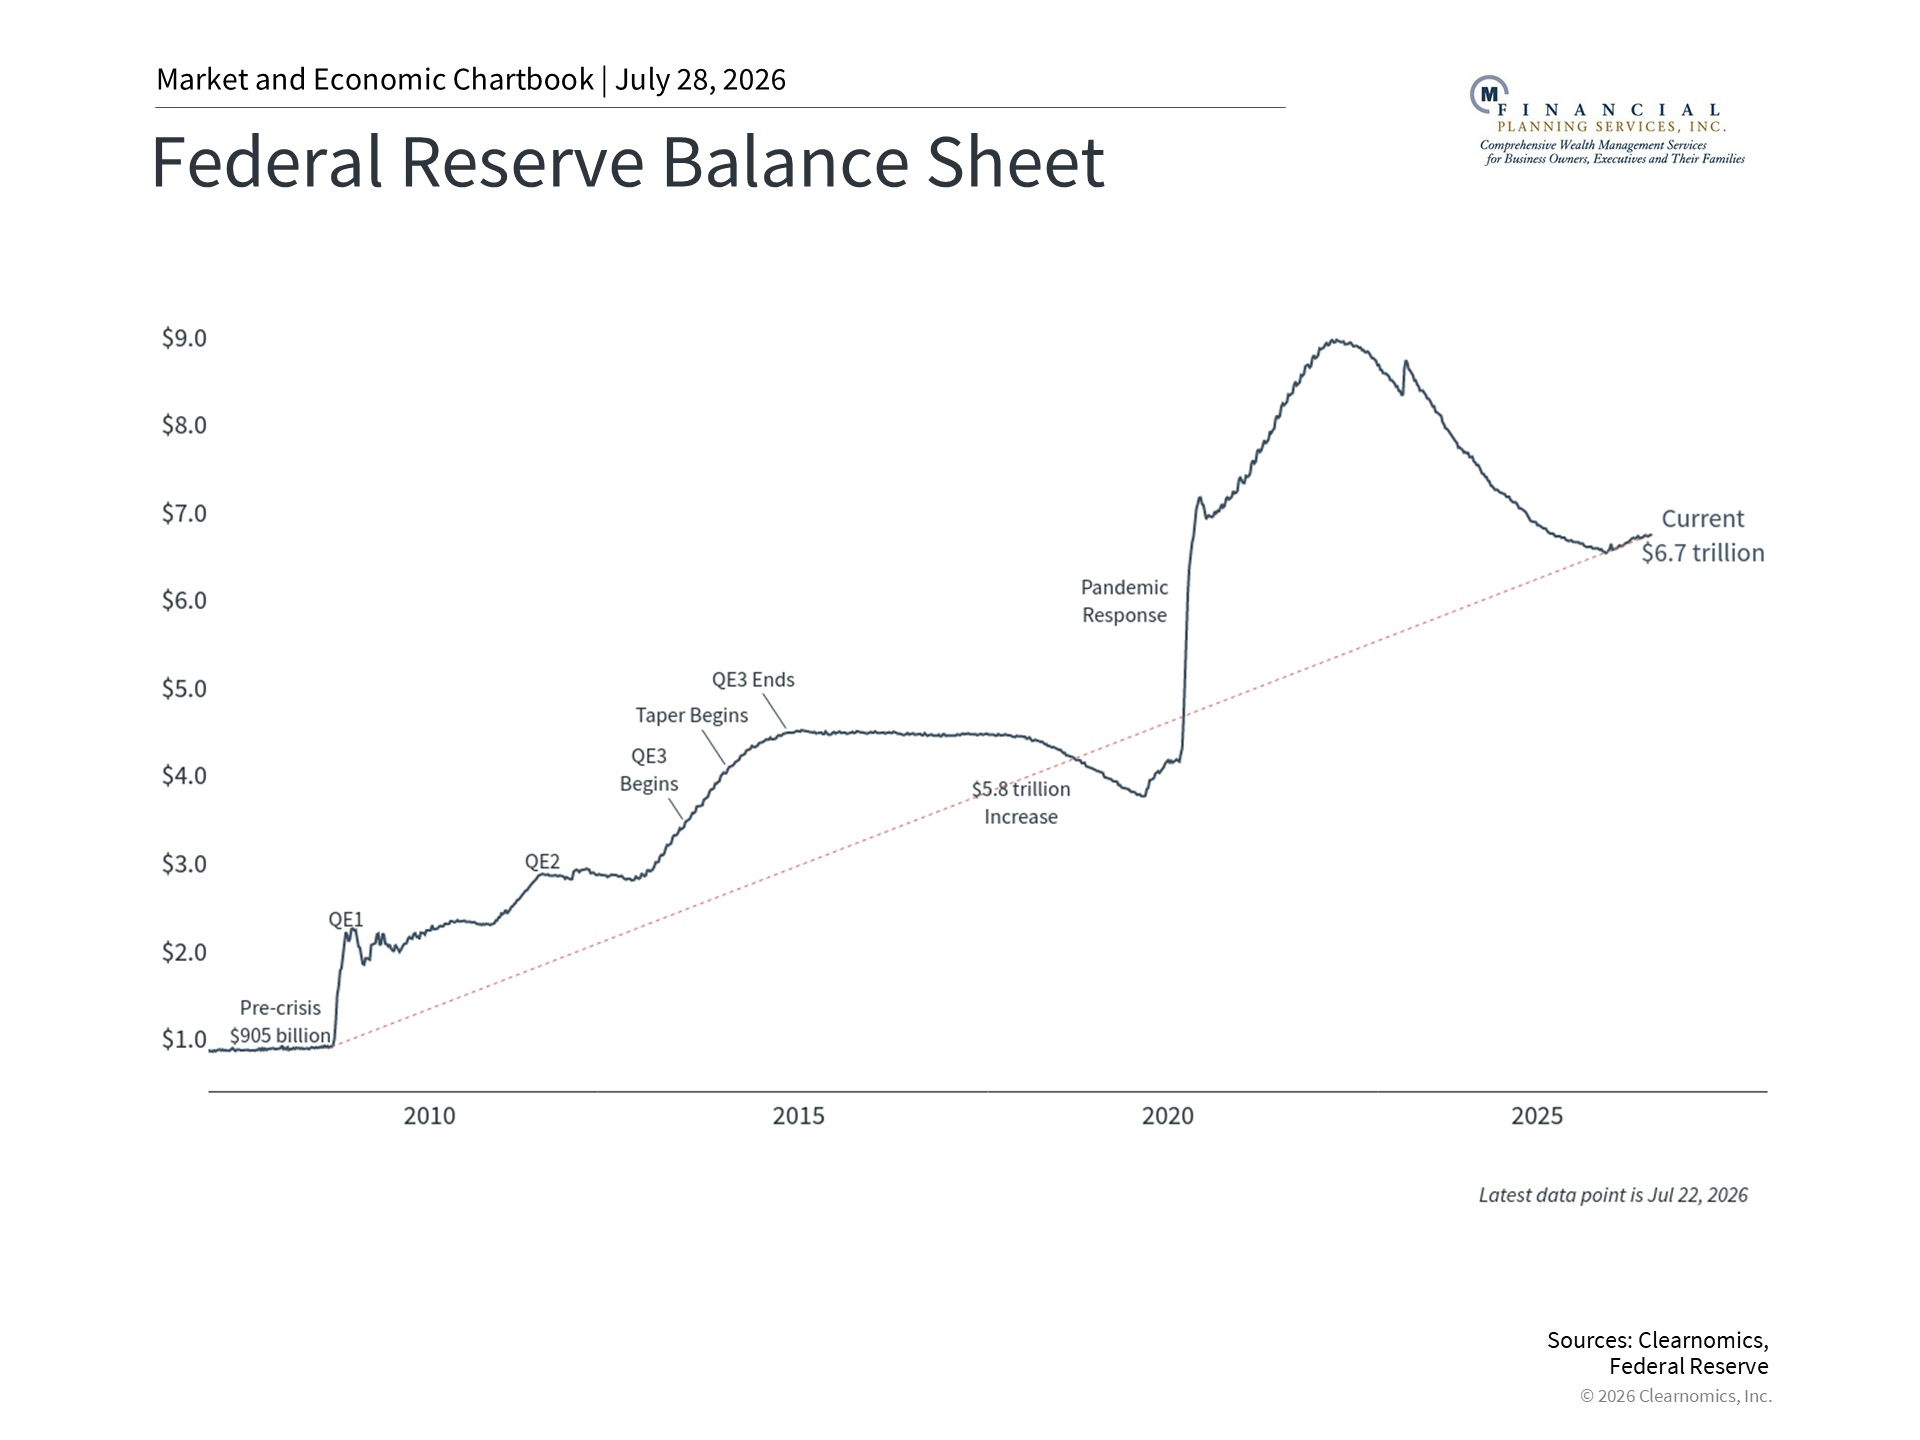
Another factor affecting bond yields is uncertainty around Fed policy under the new leadership of Kevin Warsh. One task force he has launched, for instance, seeks to address the central bank's $6.7 trillion balance sheet. As shown in the chart above, the level of assets held by the Fed has increased with each economic crisis. While it has shrunk in recent years as assets have matured, it is still far larger than it was prior to 2008.
Warsh has long held the view that the Fed ought to shrink its balance sheet when the economy is healthy. This would involve selling Treasury securities and mortgage-backed securities, which effectively pushes Treasury bond yields higher,
raising borrowing costs for businesses and homebuyers. Along with the expectation of Fed rate hikes, these actions could keep both short-term and long-term interest rates higher for longer.
For long-term investors, this means it’s more important than ever to hold a thoughtful balance of stocks, bonds, and
other assets that are designed to achieve financial goals.
The bottom line? Real yields are at their highest levels in years, driven by inflation concerns, fiscal uncertainty,
and a shrinking Fed balance sheet. A thoughtfully constructed and well-balanced portfolio aligned with financial
plans is more important than ever.
References
1. https://home.treasury.gov/policy-issues/financing-the-government/interest-rate-statistics
2. https://gasprices.aaa.com/
3. https://www.jec.senate.gov/public/index.cfm/republicans/debt-dashboard
4. Clearnomics research and LSEG data as of July 27, 2026
5. https://www.federalreserve.gov/monetarypolicy/task-forces.htm
Index Descriptions
S&P 500
The Standard & Poor’s 500 Index is a capitalization-weighted index of 500 stocks designed to measure performance of
the broad domestic economy through changes in the aggregate market value of 500 stocks representing all major
industries.
Securities and advisory services offered through LPL Financial, a registered investment advisor. Member FINRA / SIPC.
Financial planning offered through M Financial Planning Services, a Registered Investment Advisor and a separate
entity.
This material is for general information only and is not intended to provide specific advice or recommendations for any
individual. There is no assurance that the views or strategies discussed are suitable for all investors or will yield positive
outcomes. Investing involves risks including possible loss of principal. No investment strategy or risk management
technique can guarantee return or eliminate risk in all market environments Any economic forecasts set forth may not
develop as predicted and are subject to change.
References to markets, asset classes, and sectors are generally regarding the corresponding market index. Indexes are
unmanaged statistical composites and cannot be invested into directly. Index performance is not indicative of the
performance of any investment and do not reflect fees, expenses, or sales charges. All performance referenced is
historical and is no guarantee of future results.
This information is not intended to be a substitute for specific individualized tax or legal advice. We suggest that you
discuss your specific situation with a qualified tax or legal professional.
Bonds are subject to market and interest rate risk if sold prior to maturity. Bond values will decline as interest rates rise
and bonds are subject to availability and change in price.
U.S. Treasury securities are guaranteed by the federal government as to the timely payment of principal and interest.
The principal value of Treasury securities and other bonds fluctuates with market conditions.
International investments carry additional risks, which include differences in financial reporting standards, currency
exchange rates, political risks unique to a specific country, foreign taxes and regulations, and the potential for illiquid
markets. These factors may result in greater share price volatility.
This material was prepared by Clearnomics, Inc., who is not affiliated with the named financial professional, firm or
broker/dealer.
Copyright (c) 2026 Clearnomics, Inc. All rights reserved. The information contained herein has been obtained from
sources believed to be reliable, but is not necessarily complete and its accuracy cannot be guaranteed. No
representation or warranty, express or implied, is made as to the fairness, accuracy, completeness, or correctness of the
information and opinions contained herein. The views and the other information provided are subject to change without
notice. All reports posted on or via www.clearnomics.com or any affiliated websites, applications, or services are issued
without regard to the specific investment objectives, financial situation, or particular needs of any specific recipient and
are not to be construed as a solicitation or an offer to buy or sell any securities or related financial instruments. Past
performance is not necessarily a guide to future results. Company fundamentals and earnings may be mentioned
occasionally, but should not be construed as a recommendation to buy, sell, or hold the company's stock. Predictions,
forecasts, and estimates for any and all markets should not be construed as recommendations to buy, sell, or hold any
security--including mutual funds, futures contracts, and exchange traded funds, or any similar instruments. The text,
images, and other materials contained or displayed in this report are proprietary to Clearnomics, Inc. and constitute
valuable intellectual property. All unauthorized reproduction or other use of material from Clearnomics, Inc. shall be
deemed willful infringement(s) of this copyright and other proprietary and intellectual property rights, including but not
limited to, rights of privacy. Clearnomics, Inc. expressly reserves all rights in connection with its intellectual property,
including without limitation the right to block the transfer of its products and services and/or to track usage thereof,
through electronic tracking technology, and all other lawful means, now known or hereafter devised. Clearnomics, Inc.
reserves the right, without further notice, to pursue to the fullest extent allowed by the law any and all criminal and civil
remedies for the violation of its rights.